Stop making assumptions! Extract metrics from Kong API Gateway using Grafana and Prometheus

I was chatting to my brother about Kong, cluster, deployment, and how to extract metrics a few days ago. Then I'm here to show you how to use Grafana and Prometheus to collect metrics from Kong API Gateway. Metrics are a good approach to get some data to detect bottlenecks and make improvements to your stack.
Kong
If you are unfamiliar with Kong API Gateway, I recommend reading my prior article:

Kong an API Gateway is built on NGINX and allows plugins through the Lua module; however, custom plugins can now use Python, Go, and Javascript.
Kong offers two editions: community and enterprise. Private plugins, dashboard, admin, and hosting plans are available with the Enterprise edition. We must address this hole in the Community edition with Open Source Solutions; if you need a UI admin, Konga is a possibility, and you can discover some Kong plugins if the core plugins do not support your solution.
Grafana
Observability has never been more essential than right now. When working with clusters, instances with varying specs, containers, and programming languages. Analyzing metrics and displaying them in dashboards is the best way to determine what works for our stack.
Grafana is an open source analytics and monitoring tool that lets us send measurements from a wide range of data sources, including Prometheus, InfluxDB, PostgreSQL, MySQL, MSSQL, Azure Monitor, Google Cloud Monitoring, AWS CloudWatch, ElasticSearch, and others.
The most essential aspect of all metrics configuration is that we may establish alerts for Application or Business metrics:
Business
- How many payments did we receive per minute?
- How many orders are canceled per day?
- How many claims are made every hour?
Application
- How many RPS (Request per Second) do we have?
- How much CPU and RAM does the application require?
- How many messages are waiting to be processed in our queue?
- What about the http status of services?
With these statistics, we may say, "Good game, my bro!"

Prometheus
Prometheus is open source software that was created by SoundCloud in 2012. After Kubernetes, the Cloud Native Computing Foundation selected Prometheus as its second incubated project in May 2016.
The software supports event monitoring and alerting, however it lacks Grafana's excellent dashes and full-featured UI.
The example
This time, we'll build an API Gateway that supports both external APIs for retrieving values from (money and coins) and local APIs for demonstrate how Kong load balancing works with upstreams and self-healing (health-checks).
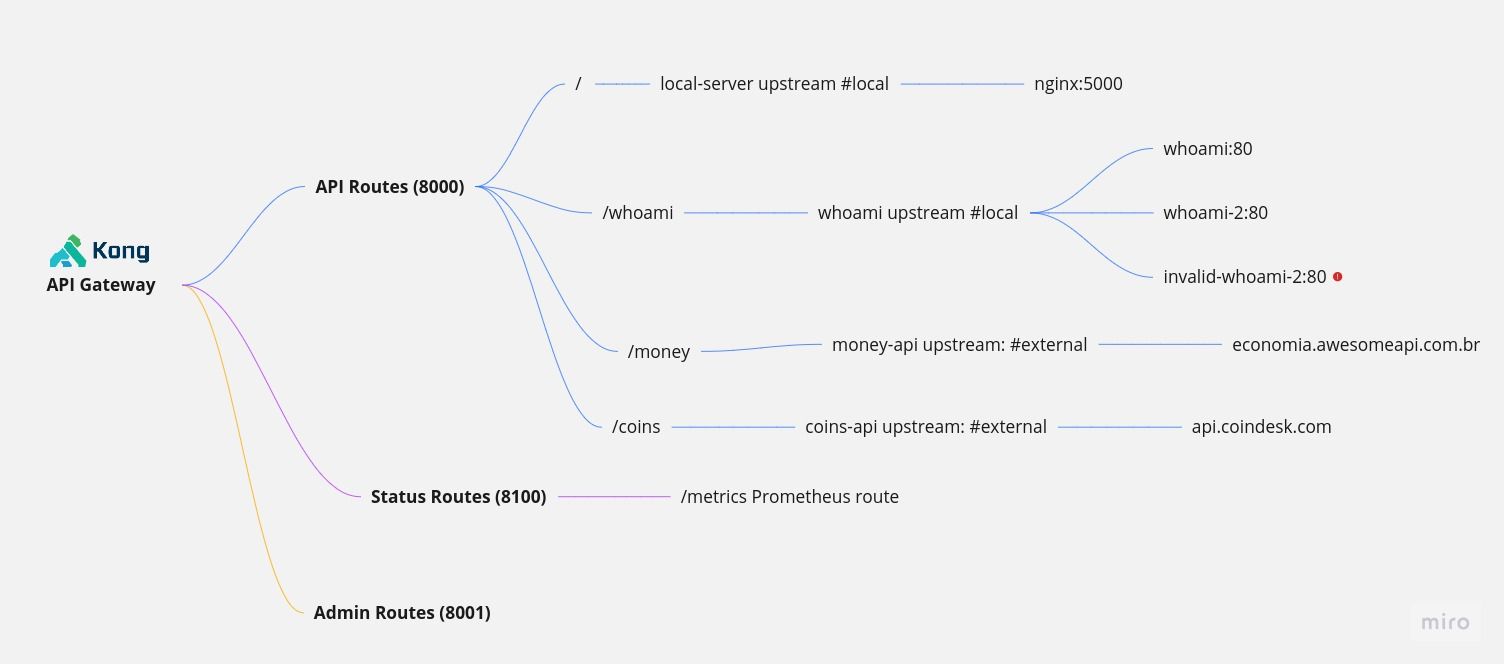
- api routes, by default, Kong listens on port 8000 for established API routes.
- admin routes, Kong allows us to handle routes, services, and plugins on port 8001, but some features will only operate in database mode, which accepts PostgreSQL and Cassandra.
- status routes, used to span metrics by available plugins such as: Prometheus.
- invalid-whoami-2, this is an invalid upstream that illustrates how an upstream operates when there is an unhealth scenario and what metrics are available.
- load balancing, is only used by whoami; other routes use upstreams with only one host and no fault tolerance.
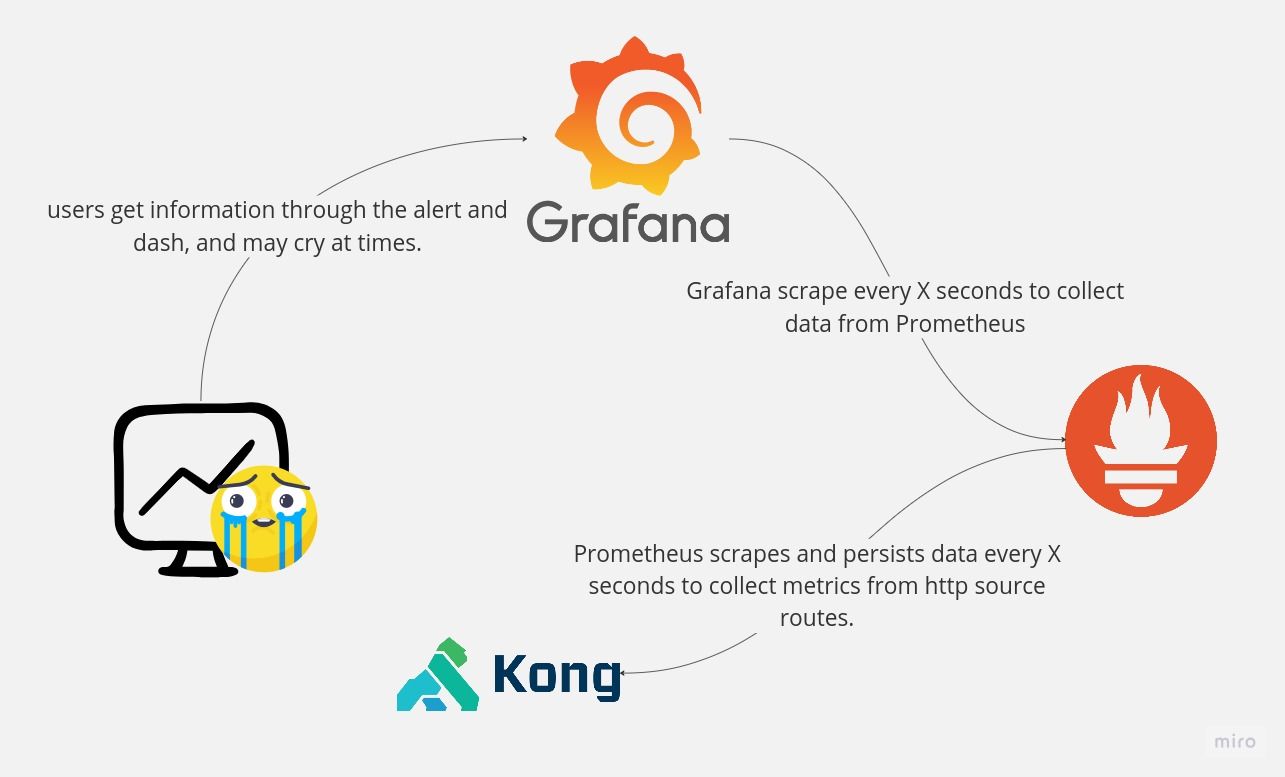
How does the integration of Grafana, Prometheus, and Kong work?
The drawings below show how metrics are translated to Dash and Alerts in Grafana using data that was initially created in Kong and set to Prometheus.
Let's look at the assets files
Please clone this repository; this example contains a lot of files, and I'll go over the important ones.
- kong/kong.yml
This file covers Kong features; only one plugin is used to get metrics for Prometheus; all metrics should be enabled to support every section of the Official Dashboard.
_format_version: "3.0"

plugins:
- name: prometheus
  config:
    status_code_metrics: true
    latency_metrics: true
    bandwidth_metrics: true
    upstream_health_metrics: true

services:
- name: hello
  url: http://local-server
  routes:
  - name: hello
    paths:
    - /

- name: whoami
  url: http://whoami
  routes:
  - name: whoami
    paths:
    - /whoami

- name: coins
  url: https://coins-api/v1/bpi/currentprice.json
  routes:
  - name: coins
    paths:
    - /coins

- name: money
  url: https://money-api/json/all
  routes:
  - name: money
    paths:
    - /money

upstreams:
  - name: coins-api
    targets:
    - target: api.coindesk.com:443

  - name: money-api
    targets:
    - target: economia.awesomeapi.com.br:443

  - name: local-server
    targets:
    - target: nginx:5000

  - name: whoami
    targets:
    - target: whoami:80
      weight: 50
    - target: whoami-2:80
      weight: 50
    - target: invalid-whoami-2:80
      weight: 1
    healthchecks:
      passive:
        healthy:
          http_statuses:
          - 200
          successes: 1
        type: http
        unhealthy:
          http_failures: 5
          http_statuses:
          - 429
          - 500
          - 503
          tcp_failures: 2
          timeouts: 2
- docker-compose.yml
A number of containers will be running concurrently:
- Kong
- Prometheus
- Grafana
- Nginx (local server)
- Traefik Whoami (used for upstream metric generation)
- Seed (used to produce metrics by making queries)
version: '3.8'

x-healthcheck: &defautl-healthcheck
  interval: 10s
  timeout: 3s
  start_period: 1s

services:
  kong:
    image: kong:3.3.1-alpine
    environment:
      KONG_LOG_LEVEL: info
      KONG_ADMIN_ACCESS_LOG: /dev/stdout
      KONG_ADMIN_ERROR_LOG: /dev/stderr
      KONG_DATABASE: "off"
      KONG_DECLARATIVE_CONFIG: /etc/kong/kong.yml
      KONG_STATUS_LISTEN: "0.0.0.0:8100"
      KONG_ADMIN_LISTEN: "0.0.0.0:8001"
    healthcheck:
        <<: *defautl-healthcheck
        test: ["CMD-SHELL", "nc -z -v localhost 8000"]
    ports:
      - "8000:8000"
      - "8001:8001"
      - "8100:8100"
    restart: unless-stopped
    networks:
      - kong-grafana
    volumes:
      - ./kong/kong.yml:/etc/kong/kong.yml
    depends_on:
      - nginx
      - whoami
      - whoami-2

  prometheus:
    image: prom/prometheus
    ports:
      - 9090:9090
    healthcheck:
      <<: *defautl-healthcheck
      test: ["CMD-SHELL", "nc -z -v localhost 9090"]
    volumes:
      - ./prometheus/prometheus.yml:/etc/prometheus/prometheus.yml
    networks:
      - kong-grafana
    depends_on:
      - kong

  grafana:
    image: grafana/grafana
    ports:
      - 9091:9091
    healthcheck:
        <<: *defautl-healthcheck
        test: ["CMD-SHELL", "nc -z -v localhost 9091"]
    volumes:
      - ./grafana/grafana.ini:/etc/grafana/grafana.ini
      - ./grafana/datasource.yaml:/etc/grafana/provisioning/datasources/datasource.yaml
      - grafana-storage:/var/lib/grafana
    networks:
      - kong-grafana
    depends_on:
      - prometheus

  nginx:
    build:
      context: ./
      dockerfile: nginx.Dockerfile
    image: nginx-local-server
    healthcheck:
      <<: *defautl-healthcheck
      test: ["CMD-SHELL", "nginx -t"]
    networks:
      - kong-grafana

  whoami:
    image: traefik/whoami
    environment:
      - WHOAMI_PORT_NUMBER=80
    networks:
      - kong-grafana

  whoami-2:
    image: traefik/whoami
    environment:
      - WHOAMI_PORT_NUMBER=80
    networks:
      - kong-grafana

  seed:
    build:
      context: ./
      dockerfile: seed.Dockerfile
    networks:
      - kong-grafana
    depends_on:
      - kong

volumes:
  grafana-storage:

networks:
  kong-grafana:
    name: "kong-grafana"
- nginx.Dockerfile
A Docker NGINX image that listens on port 5000 and contains some assets.
FROM docker.io/bitnami/nginx:1.25

ENV NGINX_HTTP_PORT_NUMBER=5000

COPY ./assets/nginx /app
- seed.Dockerfile
A Docker Alpine image was used to call API Gateway and generate certain metrics with Apache AB.
FROM alpine:latest

RUN apk add apache2-utils

COPY ./seed/test_apis.sh /test_apis.sh

RUN chmod +x /test_apis.sh

ENTRYPOINT [ "/test_apis.sh" ]
- grafana/datasource.yml
This file describes Grafana's accessible datasources.
apiVersion: 1

datasources:
  - name: Prometheus
    type: prometheus
    url: http://prometheus:9090
- prometheus/prometheus.yml
This file provides Prometheus targets for metric extraction and specifies a global interval for scraping data.
global:
  scrape_interval: 15s

scrape_configs:
  - job_name: 'kong'

    static_configs:
      - targets: ['kong:8100']
You can start containers after cloning the repository; however, ensure sure you are not using the ports specified in the docker-compose file.
docker compose up -d
There is a list of url that you can explorer:
- Hello Route
- Whoami Route
- Coins Route
- Money Route
- Kong Admin url
- Metrics url used by Prometheus
- Prometheus url
- Grafana url
The seed container will execute certain requests to generate data for Grafana; you can do more manually or relaunch the seed container with the following command:
docker compose run --rm seed --env REQUESTS=11
Prometheus metrics format
This is just part of the metrics prometheus format, which is a hash that has multiple keys and values per line; you may see more at http://localhost:8100/metrics.
# HELP kong_bandwidth_bytes Total bandwidth (ingress/egress) throughput in bytes
# TYPE kong_bandwidth_bytes counter
kong_bandwidth_bytes{service="coins",route="coins",direction="egress",consumer=""} 9410
kong_bandwidth_bytes{service="coins",route="coins",direction="ingress",consumer=""} 752
kong_bandwidth_by
tes{service="money",route="money",direction="egress",consumer=""} 20514
kong_bandwidth_bytes{service="money",route="money",direction="ingress",consumer=""} 1128
# HELP kong_datastore_reachable Datastore reachable from Kong, 0 is unreachable
Kong Dashboard
The Grafana dashboard can be accessed via http://localhost:9091/. using such strong default credentials (admin/admin). After signing in, browse to Dashboard > Manager > Import.
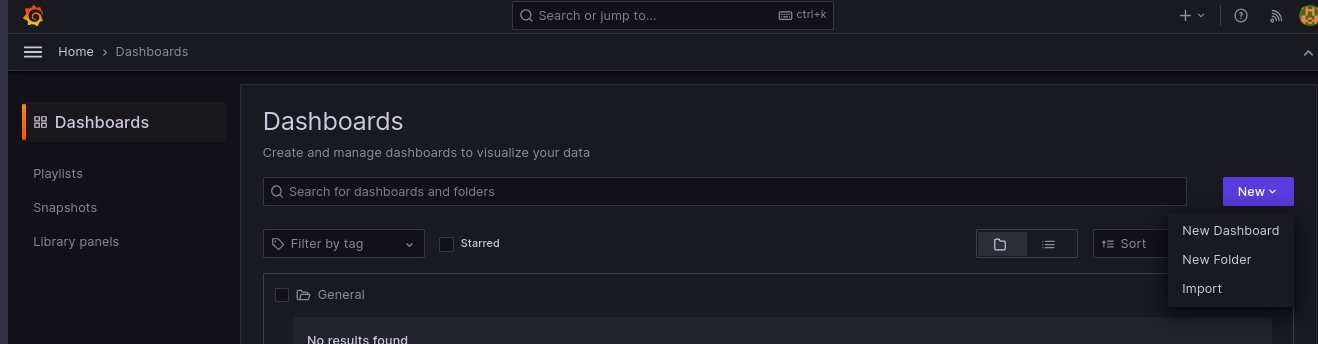
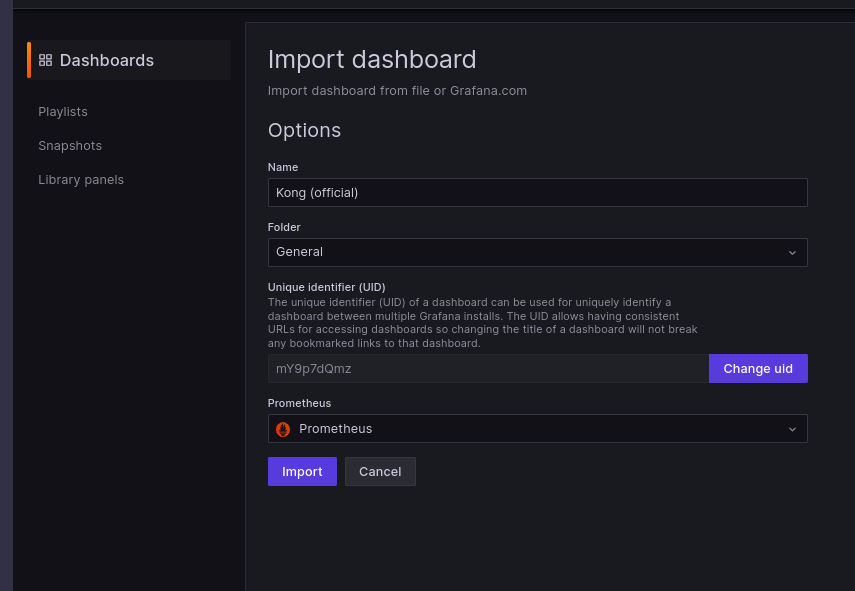
Then import a file from Kong's official dashboard, choose only one Prometheus DataSource, and you can now view the dashboard and metrics.
Alerts
To establish allerts, identify a specific metric and create values for ok, warn, and error, as we do in other tools such as New Relic, DataDog, CloudWatch, and so on. This configuration may be found at http://localhost:9091/alerting.
The image below shows an alert example in which the request count from the kong_http_requests_total metric is used to determine whether Kong is receiving requests.
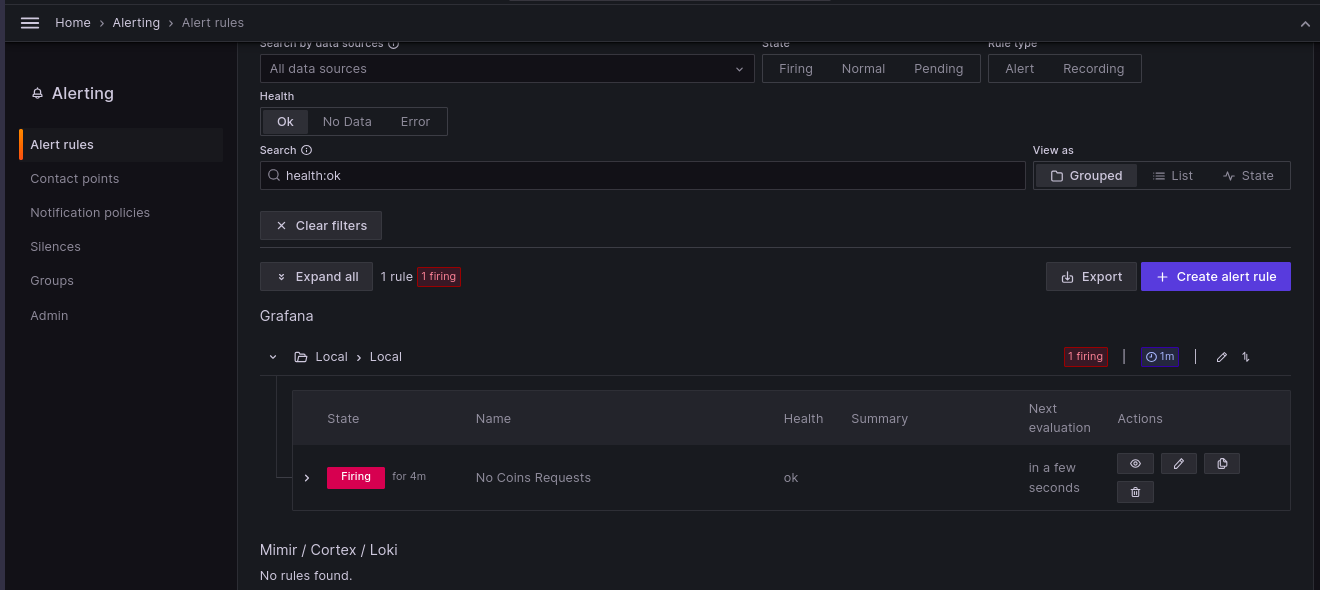
It is normal to receive email alerts, thus to make this function, you must configure smtp settings in the grafana.ini file.
[smtp]
enabled = false
host = localhost:25
user =
# If the password contains # or ; you have to wrap it with triple quotes. Ex """#password;"""
password =
cert_file =
key_file =
skip_verify = false
from_address = [email protected]
from_name = Grafana
ehlo_identity =
startTLS_policy =

[emails]
welcome_email_on_sign_up = false
templates_pattern = emails/*.html
That's all
I hope you found this article useful; I attempted to provide a sandbox for you to begin exploring with metrics while avoiding making assumptions about performance, issues, and migrations.
This post does not cover how to create custom metrics using Prometheus power; rather, we used metrics offered by the Kong Plugin that were Prometheus-specified.
We have several applications and frameworks that generate metrics in Prometheus format, but if you want to produce business metrics, you'll have to get your hands dirty.
You may create a wonderful Dash in Grafana, but don't waste your time before looking at the official Dash.
Keep your dash and kernel 🧠 up to date. God's 🙏🏿 blessings on you.
Time for feedback!