Understanding the ELK Stack with Practical Examples

This article is for those who want to learn about the ELK stack, specifically how Elasticsearch, LogStash, and Kibana communicate and what each project's responsibilities are.
When I decided to explore Elasticsearch a few years back, I was amazed with its capabilities; with the well-documented API, I had no trouble indexing my hello world documents. I was working with Apache Solr and Lucene at the time, and I recall having some trouble comprehending this stack, which was also hard to install locally. When I was comparing Elasticsearch, Solr, and Sphinx, I read that Elasticsearch indexes documents more faster than Solr + Lucene. Then I thought, huh, interesting. I encourage you do this, not to criticize projects, but to understand where the projects are suitable.
Elasticsearch
Is a distributed, free, and open search and analytics engine that can handle textual, numerical, geographic, structured, and unstructured data. Is built on Apache Lucene and is written in Java and has official client support in Java, C#, Ruby, Python, and PHP. It is essential to know that you can use API to manage documents when there is no official client.
When full-text search resources are not appropriate for your project, Elasticsearch comes to play.
LogStash
Is a free and open server-side data processing pipeline that collects data from many sources, transforms it, and then sends it to your chosen "stash."
It might be difficult to develop and manage workers and schedulers to handle document updates, therefore LogStash allows us to send data to any destination, for example, you can import document updates from files and send to Elasticsearch, or import data from RabbitMQ and send to Elasticsearch.
You can use any approach to keep your cluster healthy and scalable ❤️.
Kibana
Is a free and open-source frontend application that runs on top of the Elastic Stack and provides search and data visualization features for Elasticsearch-indexed data. Also known as the Elastic Stack charting tool.
Stack
Okay! Show me the stack in running, please.
We can manually install this stack...

Sorry, but containers are the greatest way to learn and keep things up to date. Remember that adding more languages, frameworks, and containers will result in new vulnerabilities; there is no gain without pain. So, my advise is to make things simple to test and update.
Let's get started with the docker compose file, with some containers and asset.
- docker-compose.yml
version: '3.8'

name: elk

services:
  fake-logger:
    image: willsenabr/fake-logger
    logging:
      driver: gelf
      options:
        tag: dev
        gelf-address: udp://localhost:12201
    environment:
      DELAY: 1000
    depends_on:
      - logstash

  elasticsearch:
    image: bitnami/elasticsearch:8
    ports:
      - 9200:9200
    volumes:
      - elasticsearch-data:/bitnami/elasticsearch/data
    environment:
        discovery.type: single-node
        ELASTICSEARCH_PORT_NUMBER: 9200
        ELASTICSEARCH_CLUSTER_NAME: docker-elk
        ES_JAVA_OPTS: -Xms512m -Xmx512m

  logstash:
    image: bitnami/logstash:7
    ports:
      - "12201:12201/udp"
      - "5044:5044"
    environment:
      LOGSTASH_PIPELINE_CONF_FILENAME: "logstash_docker.conf"
    volumes:
      - ./assets/logstash/pipeline:/bitnami/logstash/pipeline
    depends_on:
      - elasticsearch

  kibana:
    image: bitnami/kibana:7
    ports:
      - 5601:5601
    environment:
      - KIBANA_ELASTICSEARCH_URL=elasticsearch
    volumes:
      - kibana-data:/bitnami/kibana
    depends_on:
      - elasticsearch

volumes:
  elasticsearch-data:
  kibana-data:

networks:
  default:
    name: elk
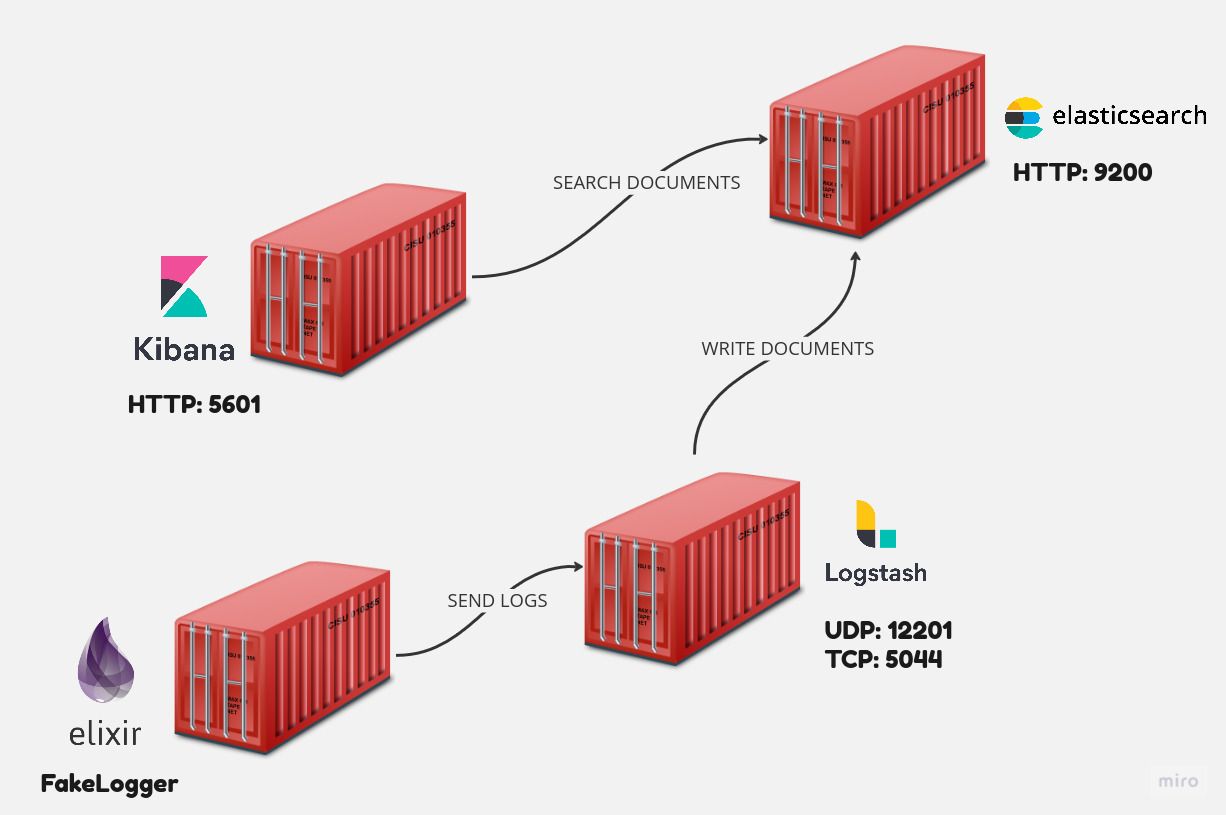
The compose file defines containers that function on the same network as "elk" and have persistent volumes, such as Elasticsearch and Kibana. The most significant parameters is container fake-logger, which changes the default docker logs to Graylog Extended Format (Gelf) instead default file.
- fake-logger, generates data for LogStash by writing random logs to stdout and utilizing the loggin driver Graylog Extended Format (Gelf), which sends logs via UDP. I built this Elixir application, and you can find out more about it on my Github repository;
- elasticsearch, container listening on TCP port 9200 by default;
- logstash, container listing ports 5044, 12201 (gelf port) The plugin logstash-gelf listens on this port;
- kibana, container listening on HTTP port 5601 by default, UI that translates ElasticSearch-indexes to data visualization, such as Dashboards;
- ./assets/logstash/pipeline/logstash_docker.conf
input {
  gelf {
    id => "docker_gelf_plugin"
    type => docker
    host => "0.0.0.0"
  }
}

output {
  stdout {}
  elasticsearch {
    hosts => ["http://elasticsearch:9200"]
    index => "docker"
  }
}
The LogStash setup pipeline specifies a Greylog Extended Format (Gelf) input with LogStash plugin support and an Elasticsearch index named docker output.
Simply put, fake-logger sends logs to LogStash, LogStash sends logs to Elasticsearch, and Kibana provides data visualization.
Running containers
It's time to start running containers with the following command:
docker compose up -d
Wait for the containers to be up and running and enjoy some coffee ☕.
Now we need to look at the LogStash logs and configure the Elastisearch index pattern in Kibana.
docker compose logs logstash -f
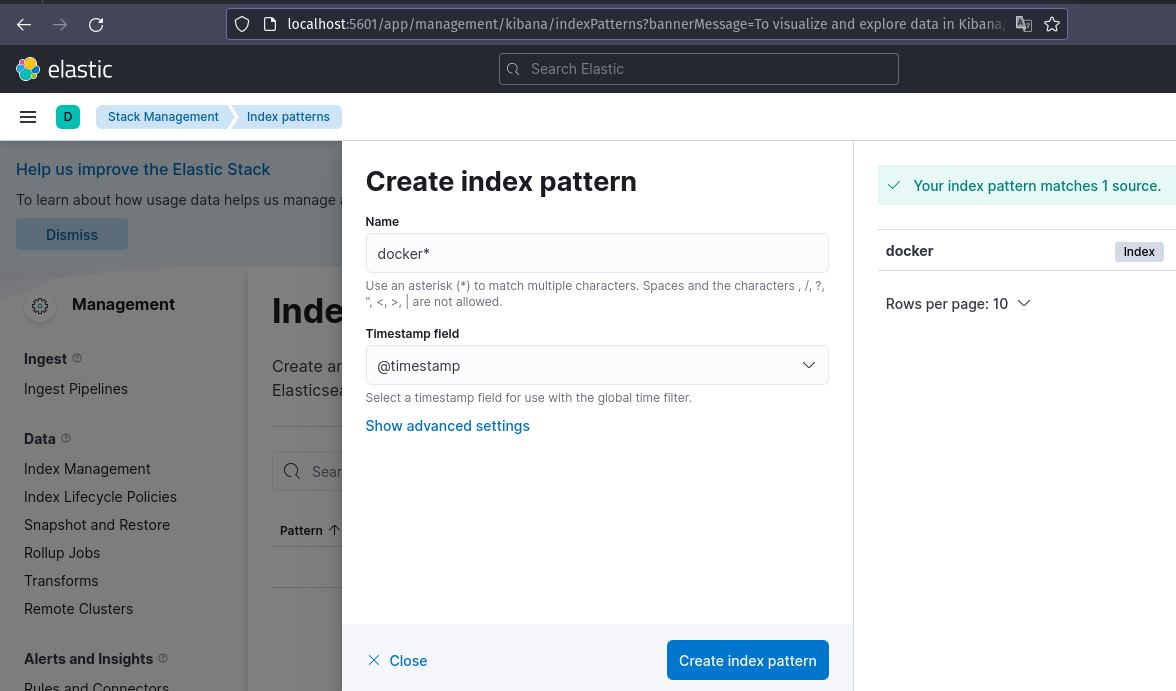
Kibana may be accessed at http://localhost:5601. Set the name of the index to docker*.
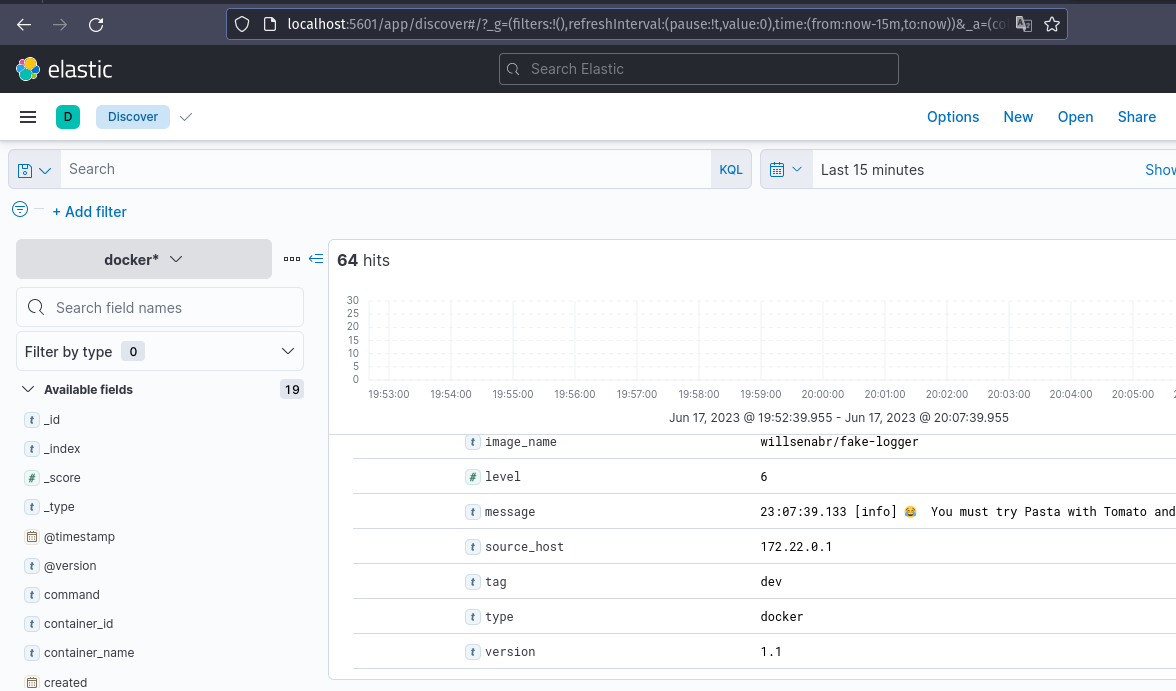
Following these settings, you may discover expected logs in Kibana discovery.
This is an option if accessible log services like DataDog Services, Cloud Watch, Papertrail, Logly, and a hundred other options are not low-cost for your Cloud.
Elasticsearch API
LogStash is in charge of receiving input data and sending it to Elasticsearch, however we handle this directly to the API using an Elasticsearch Client. I will show how to send a document to Elasticsearch. It important to note that we do not configure any indexes; this topic may be relevant to a future piece on Elasticsearch features.
List all indices
curl --location 'http://localhost:9200/_cat/indices'
Create document
curl --location 'http://localhost:9200/docker/_doc' \
--header 'Content-Type: application/json' \
--data-raw '{
    "@timestamp": "2099-01-01T00:00:00",
    "type": "docker",
    "message": "Bar message",
    "command": "/home/foo/bar"
}'
Search documents
curl --location 'http://localhost:9200/docker/_search' \
--header 'Content-Type: application/json' \
--data '{
  "query": {
    "bool": {
      "filter": [
        { "term": { "type": "docker"   }}
      ]
    }
  }
}'
Get, update and delete document by ID
Remember to change the DOCUMENT_ID.
GET
curl --location 'http://localhost:9200/docker/_doc/DOCUMENT_ID'
UPDATE
curl --location --request PUT 'http://localhost:9200/docker/_doc/DOCUMENT_ID' \
--header 'Content-Type: application/json' \
--data '{
    "type": "docker",
    "message": "Bar message2",
    "command": "/home/foo/bar"
}'
DELETE
curl --location --request DELETE 'http://localhost:9200/docker/_doc/DOCUMENT_ID'
More features may be found at Elasticsearch Index API.
Next steps
You may get the source code from my Github repository.
I didn't include FileBeat, which was built by the ELK team, but it may be used in place of LogStash in certain cases. In general, Filebeat uses less RAM than LogStash but has fewer input plugins, therefore both solutions might be used to deliver documents to ElasticSearch or any target, but you must decide which matches your project best.
Today I'll show you how to utilize ELK in practice by employing all of the letters in the acronym. That's all for now; please leave your thoughts and suggestions so that I may better my future posts.
Have a nice day, and keep your kernel 🧠 up to date. God's 🙏🏿 blessings on you.
Time for feedback!